Loyalty Analytics
Loyalty Analytics shows what your rewards program and your promotions are actually doing for your store — how much revenue store credit brings in, how each workflow is performing, and how well your promotions convert. It also offers a more rigorous way to measure a promotion's effect: comparing shoppers who saw it against a control group who didn't.
This guide covers every screen that shows loyalty numbers, what each number means, and how to read the attributed-versus-incremental revenue measurement.
Where to find it
| Screen | What it shows |
|---|---|
| Analytics → Loyalty & promotions tab | The full picture: revenue, program totals, workflows, top promotions. Shares its date range with the Gift cards tab. |
| Loyalty Dashboard | A compact value strip with the same headline numbers and a workflows table, over the last 7, 30, or 90 days. A View full analytics → link opens the Analytics tab. |
| Workflow builder → Performance | One workflow's runs, rewards, and estimated redemption — plus a Results on canvas overlay. |
| Promotions list | A 30-day Impressions / CTR / Orders / Revenue column set for every promotion. |
| Promotion editor → Performance card | One promotion's funnel: shown, clicked, added to cart, ordered. |
| Loyalty Settings → Analytics | Choose how promotion revenue is measured — attributed or incremental — and see whether your store has enough traffic for incremental measurement. |
The Loyalty & promotions tab sits next to Gift cards at the top of the Analytics page. It appears once Loyalty is enabled for your store. Until your first workflow exists, the tab shows a short "What loyalty gives you" page with a Set up loyalty button.
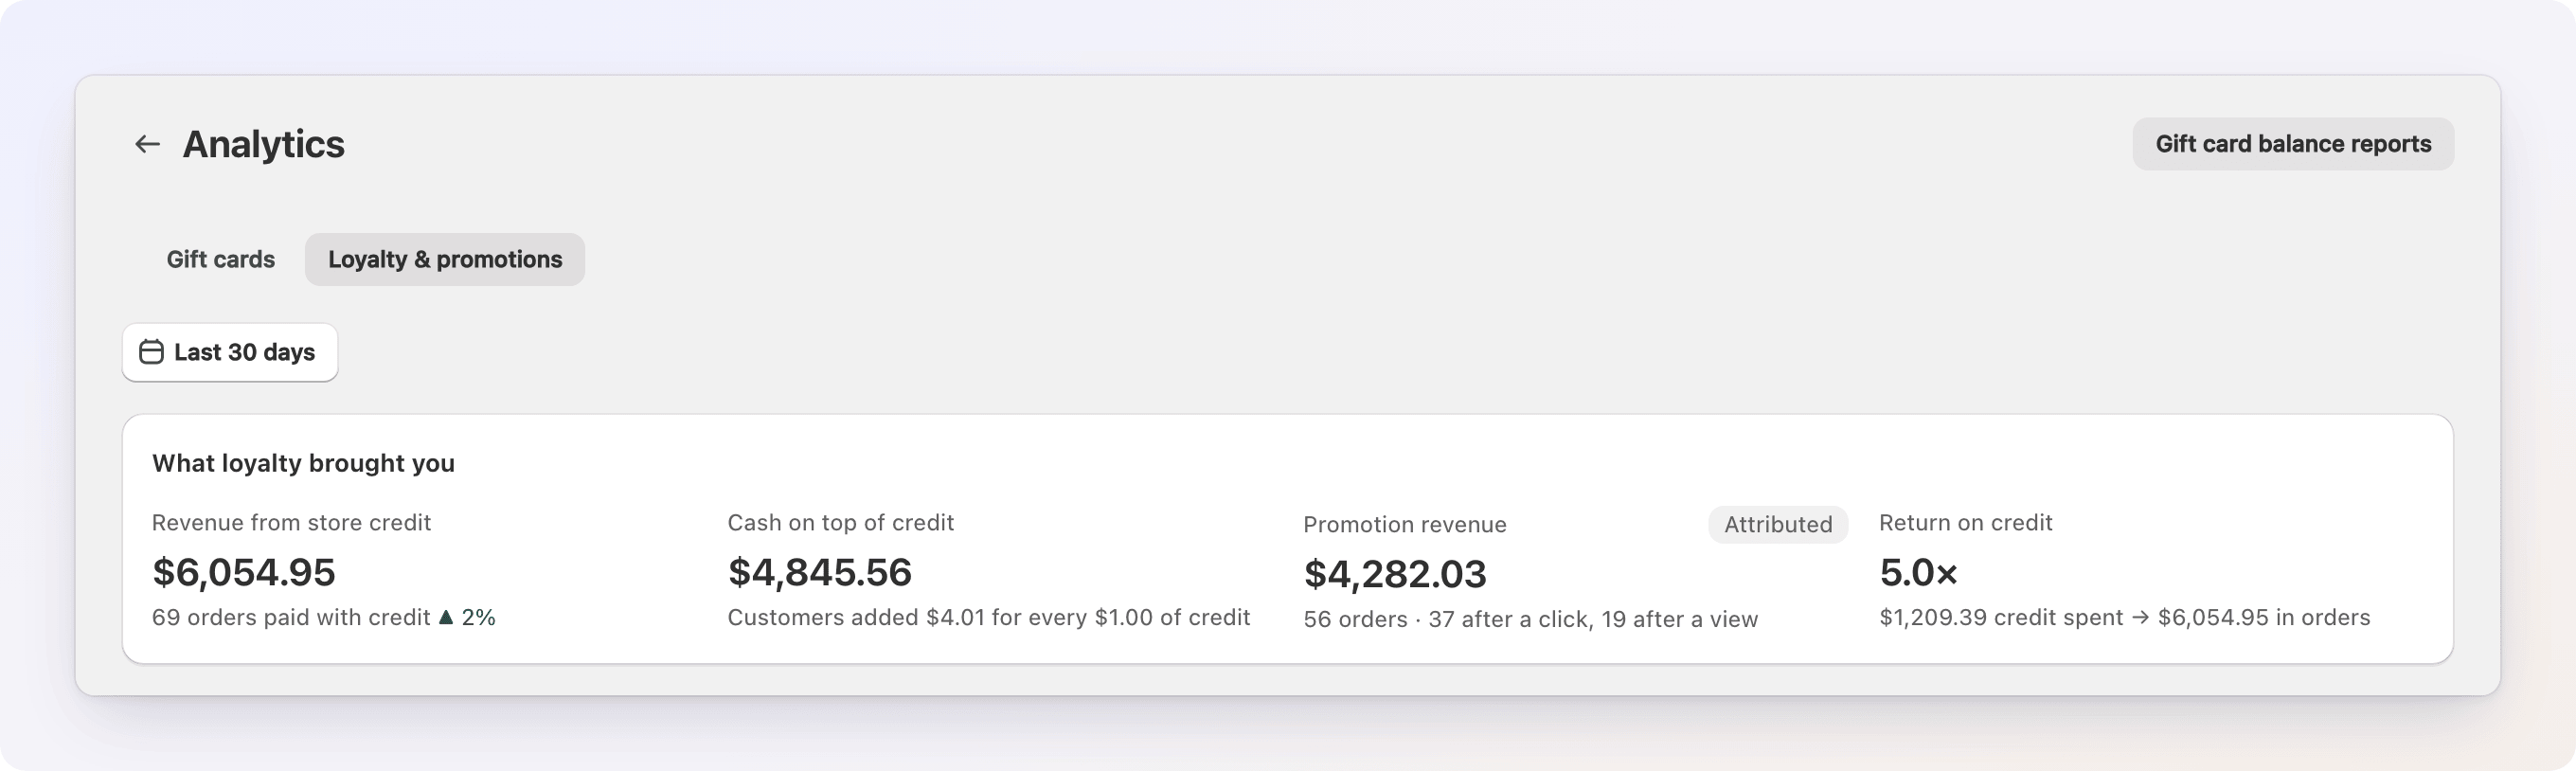
What loyalty brought you
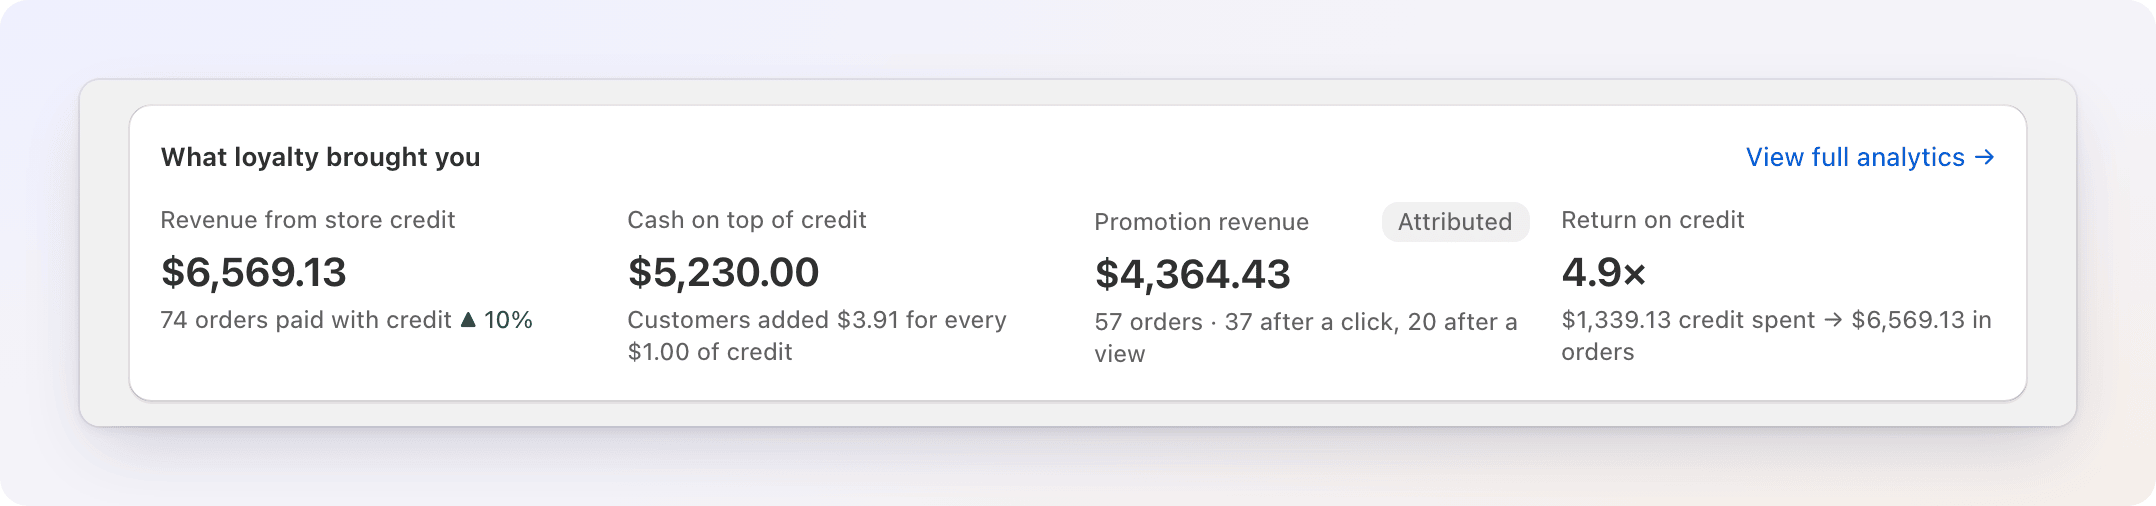
Both the Analytics tab and the Loyalty Dashboard show the same value strip.
| Tile | What it means |
|---|---|
| Revenue from store credit | The total value of every order that spent store credit in the selected period, and how many orders those were ("N orders paid with credit"). An order that used credit counts once, whatever else the customer paid with. A ▲/▼ badge compares against the previous period of equal length. It appears when the previous period had revenue to compare with. |
| Cash on top of credit | Revenue from those orders minus the credit spent on them — the extra cash customers added at checkout. The caption says how much customers added for every $1 of credit. |
| Promotion revenue | With attributed measurement (the default), the revenue of orders that followed a promotion, marked Attributed, with the number of orders after a click and after a view. With incremental measurement, the tile is called Extra revenue from promotions. See Attributed vs. incremental revenue below. The tile is hidden until you have run a promotion. |
| Return on credit | Revenue from store credit ÷ credit spent, as a multiplier (for example 3.2×). Shows — when no credit was spent in the period. |
On the Loyalty Dashboard, this same strip carries a View full analytics → link that takes you to the Loyalty & promotions tab. The dashboard has its own period buttons (7 days, 30 days, 90 days), and the Analytics tab uses the page's date range.
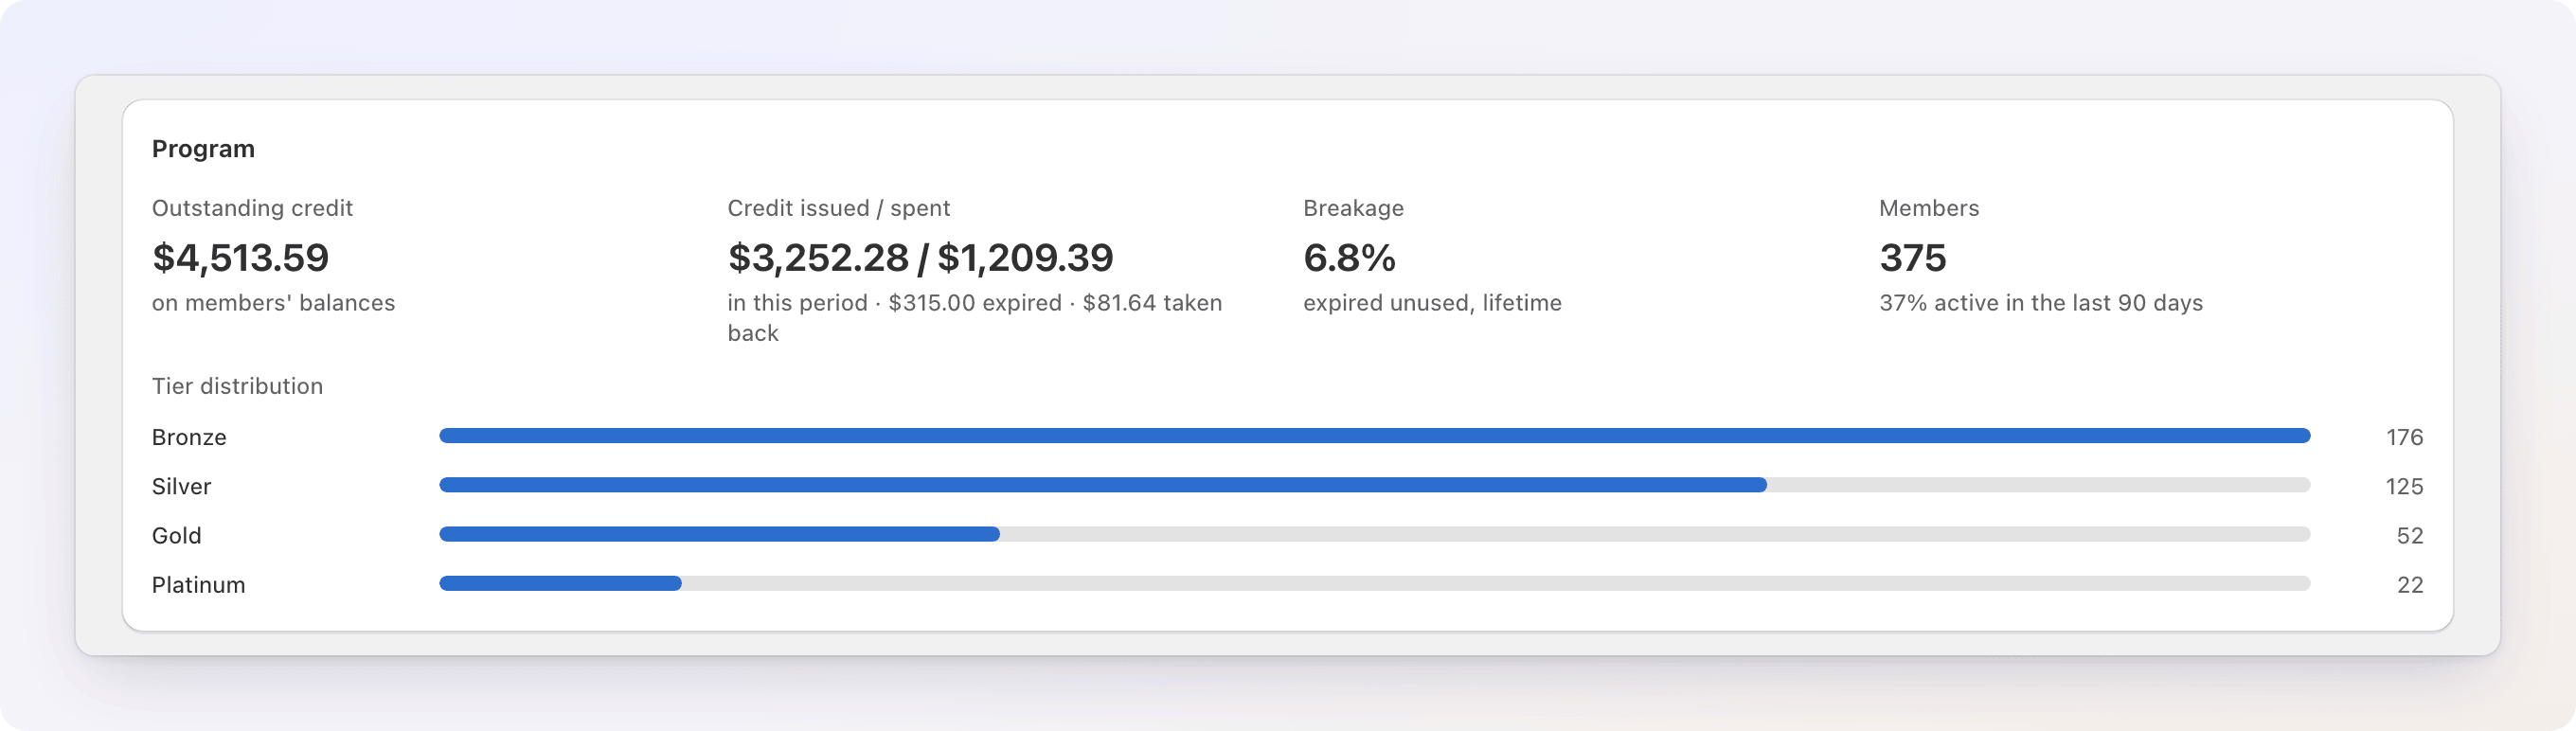
Program numbers
Below the value strip on the Analytics tab, the Program card shows the health of your rewards program as a whole. Some figures follow the date range you picked and some don't; the table says which.
| Metric | What it means |
|---|---|
| Outstanding credit | The total balance sitting on members' accounts right now (not scoped to the date range). |
| Credit issued / spent | How much credit has been handed out and how much customers have spent in the period, with the expired and taken back (refund clawback) amounts underneath. |
| Breakage | The lifetime share of issued credit that has expired unused, as a percentage. This is a lifetime figure, not scoped to your date range. |
| Members | How many customers have a rewards account, with the share who are active — meaning they spent credit in the last 90 days — underneath. Not scoped to the date range. |
| Tier distribution | How many members sit in each tier, as a bar per tier. |
Underneath, two tables round out the tab:
- Workflows — every workflow, sorted by runs, with Runs, the share that took an action (a run can trigger and then skip every step if a condition fails), and Credit issued in the period. The credit figure is what the workflow handed out, before any refunds or expirations. Click a workflow name to open it.
- Promotions — your top 5 promotions by attributed revenue in the period, with Orders and Revenue. Click All promotions to see the full Promotions list.
Workflow performance
Open a saved workflow in the builder and click Performance in the toolbar to see how that one workflow is doing. Switch between 7d, 30d, 90d, and All at the top of the panel. Before the workflow has run in the period, the panel says "No runs in this period yet."
| Metric | What it means |
|---|---|
| Runs | How many times the workflow fired, with the share that took an action underneath (a run can end without doing anything if a condition doesn't match). |
| Customers rewarded | Unique customers who received something from this workflow in the period. |
| Net credit | Credit issued minus refunds (clawback) and expirations, with the breakdown underneath. All three figures are exact. |
| Orders rewarded | The number of orders this workflow rewarded, with the total value of those orders underneath. This is the value of the orders themselves, not extra revenue the workflow caused — it's not a lift measurement. If the value of an order wasn't recorded, the order is counted but adds nothing to the value, and the caption says "N without amount". |
| Credit spent (estimate) | The share of this workflow's issued credit that customers have gone on to spend, lifetime. |
| Revenue (estimate) | Revenue from the orders where customers spent that credit, lifetime. |
Why Credit spent and Revenue are estimates
Credit from every workflow lands in the same rewards balance — there's no separate "pot" per workflow. When a customer spends their balance, Gift Card Hero can't know which workflow's credit paid for it, so it splits the spend across the workflows that funded that customer's balance, in proportion to how much each one contributed. That's why these two numbers carry an Estimate badge and are always lifetime figures, even when you're looking at a shorter period.
Below the tiles, a small chart plots runs per day, with the "took an action" line dashed underneath it.
If a guardrail blocked rewards in the period, a warning at the bottom of the panel says how many rewards and how much credit were blocked. Click Show details to see which limit was reached, how to change it, and the five most recent blocked rewards with links to the order and the customer.
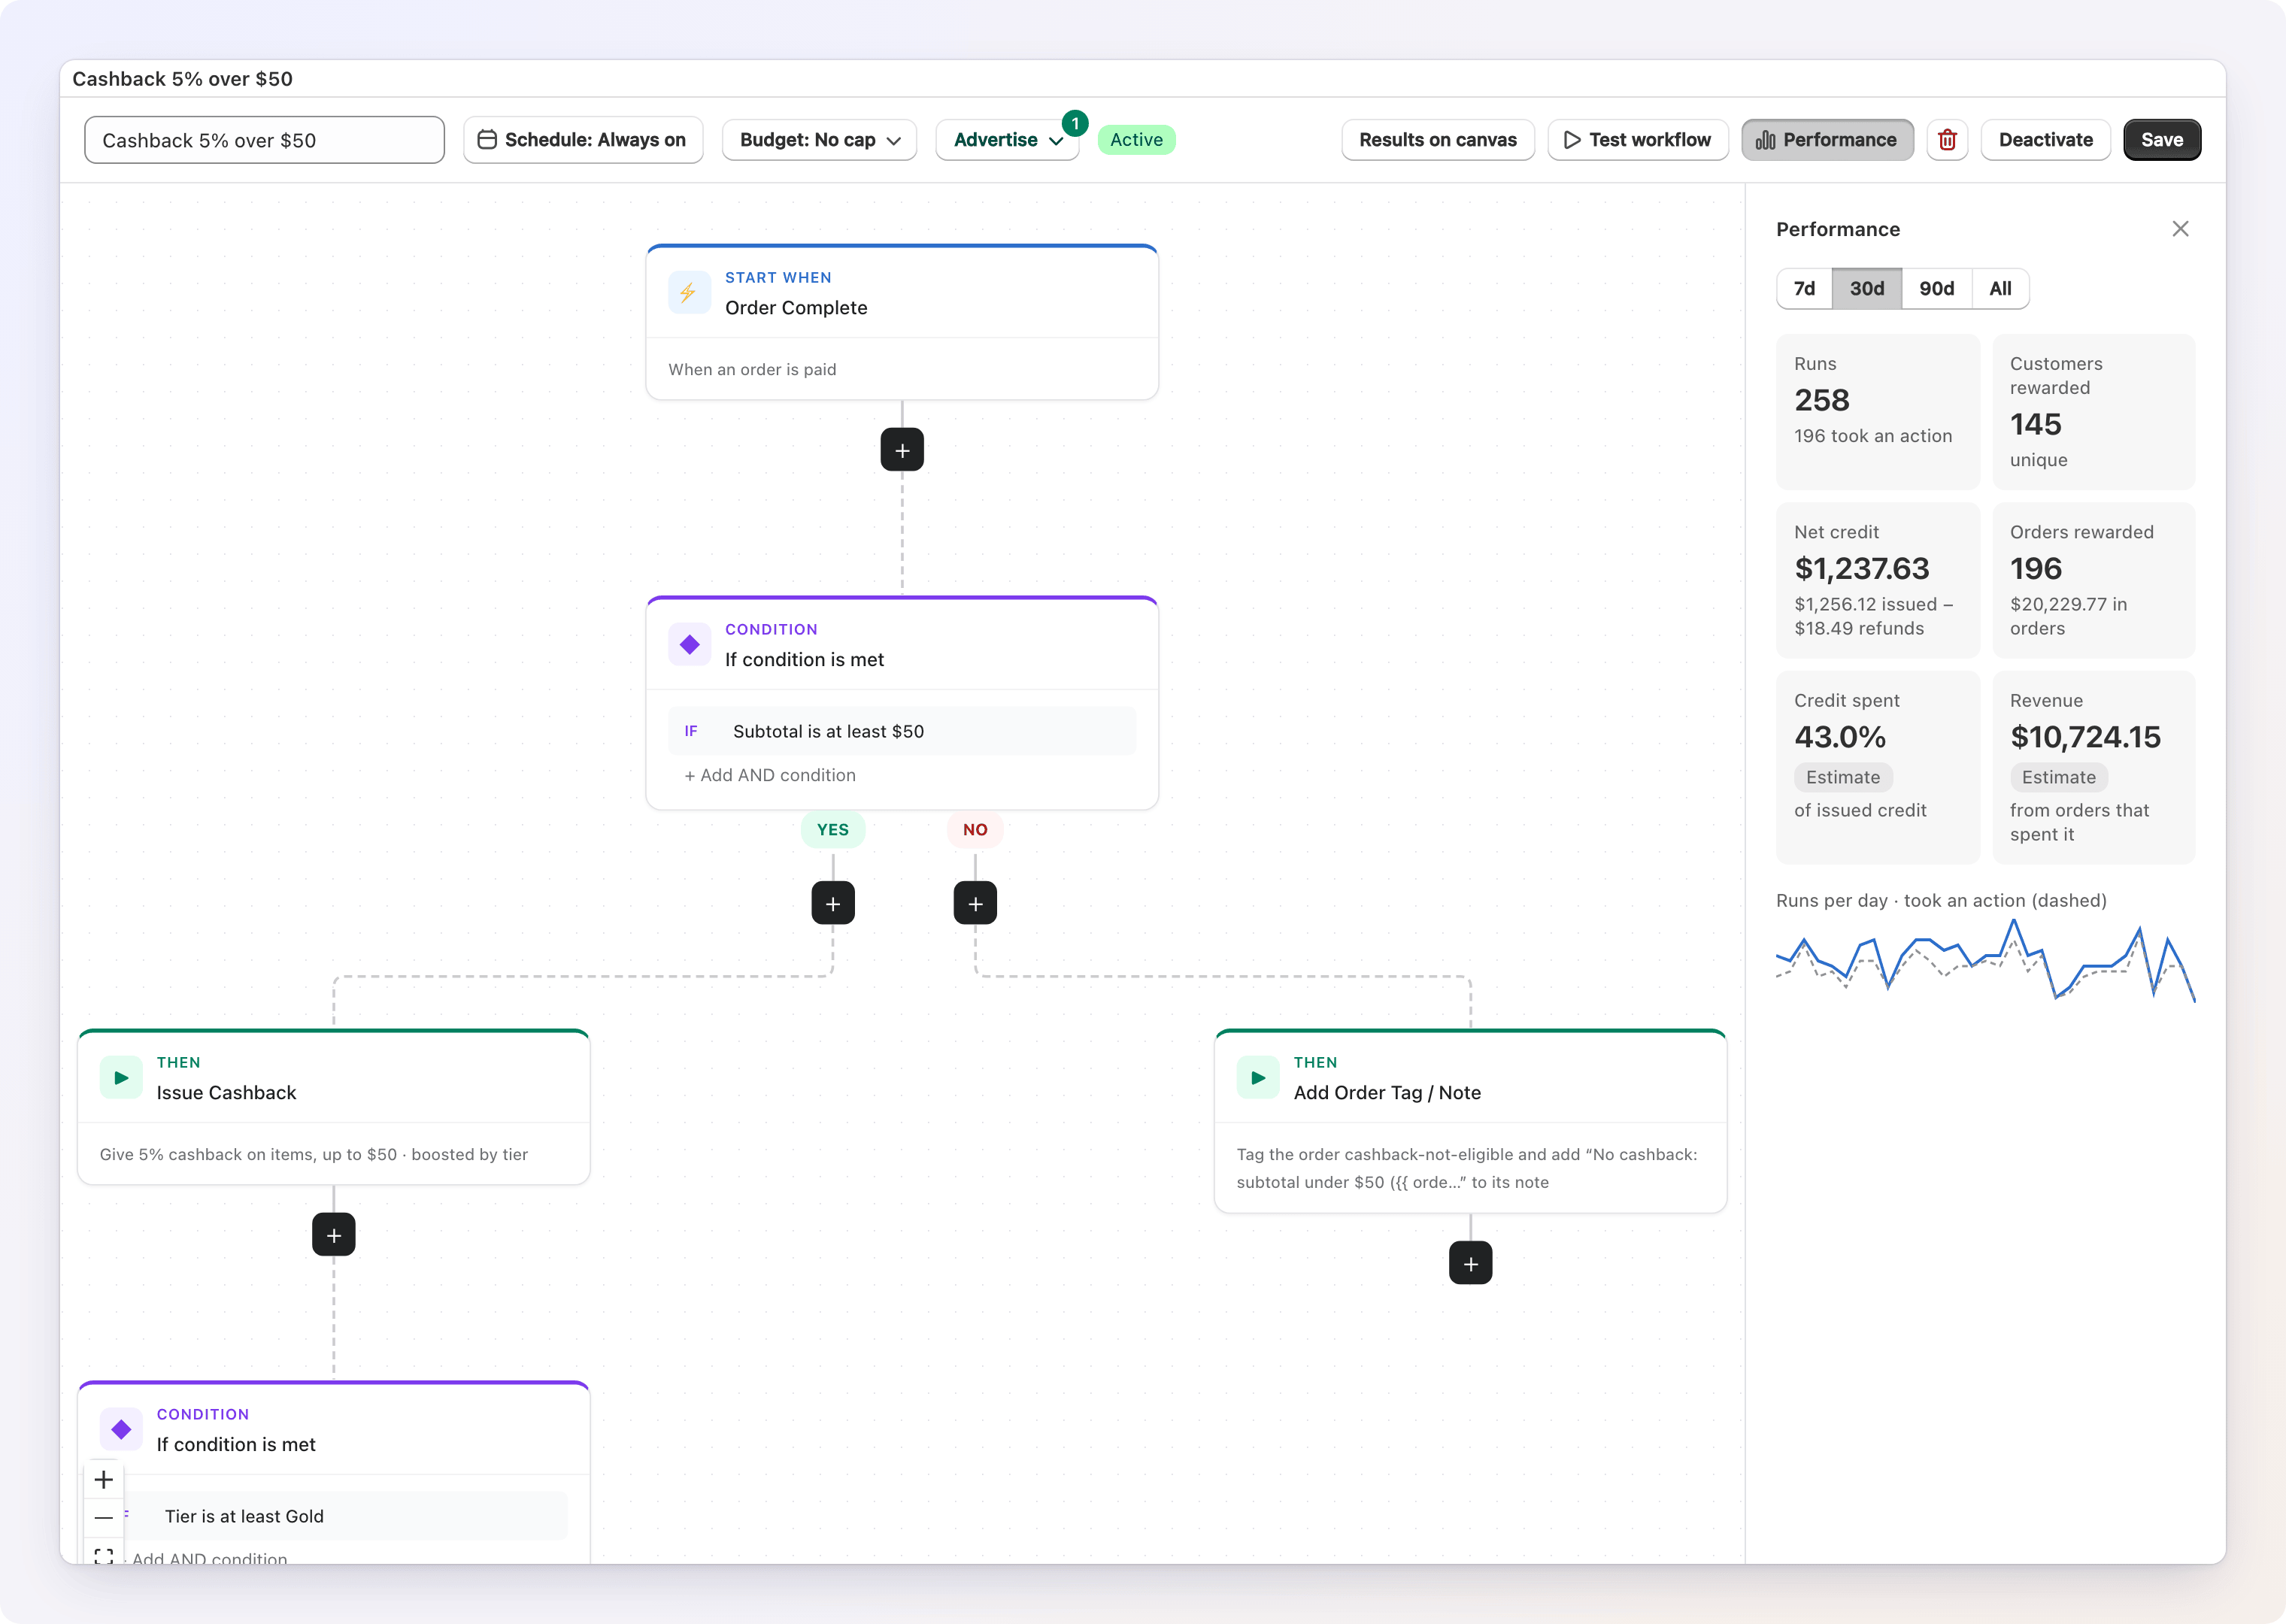
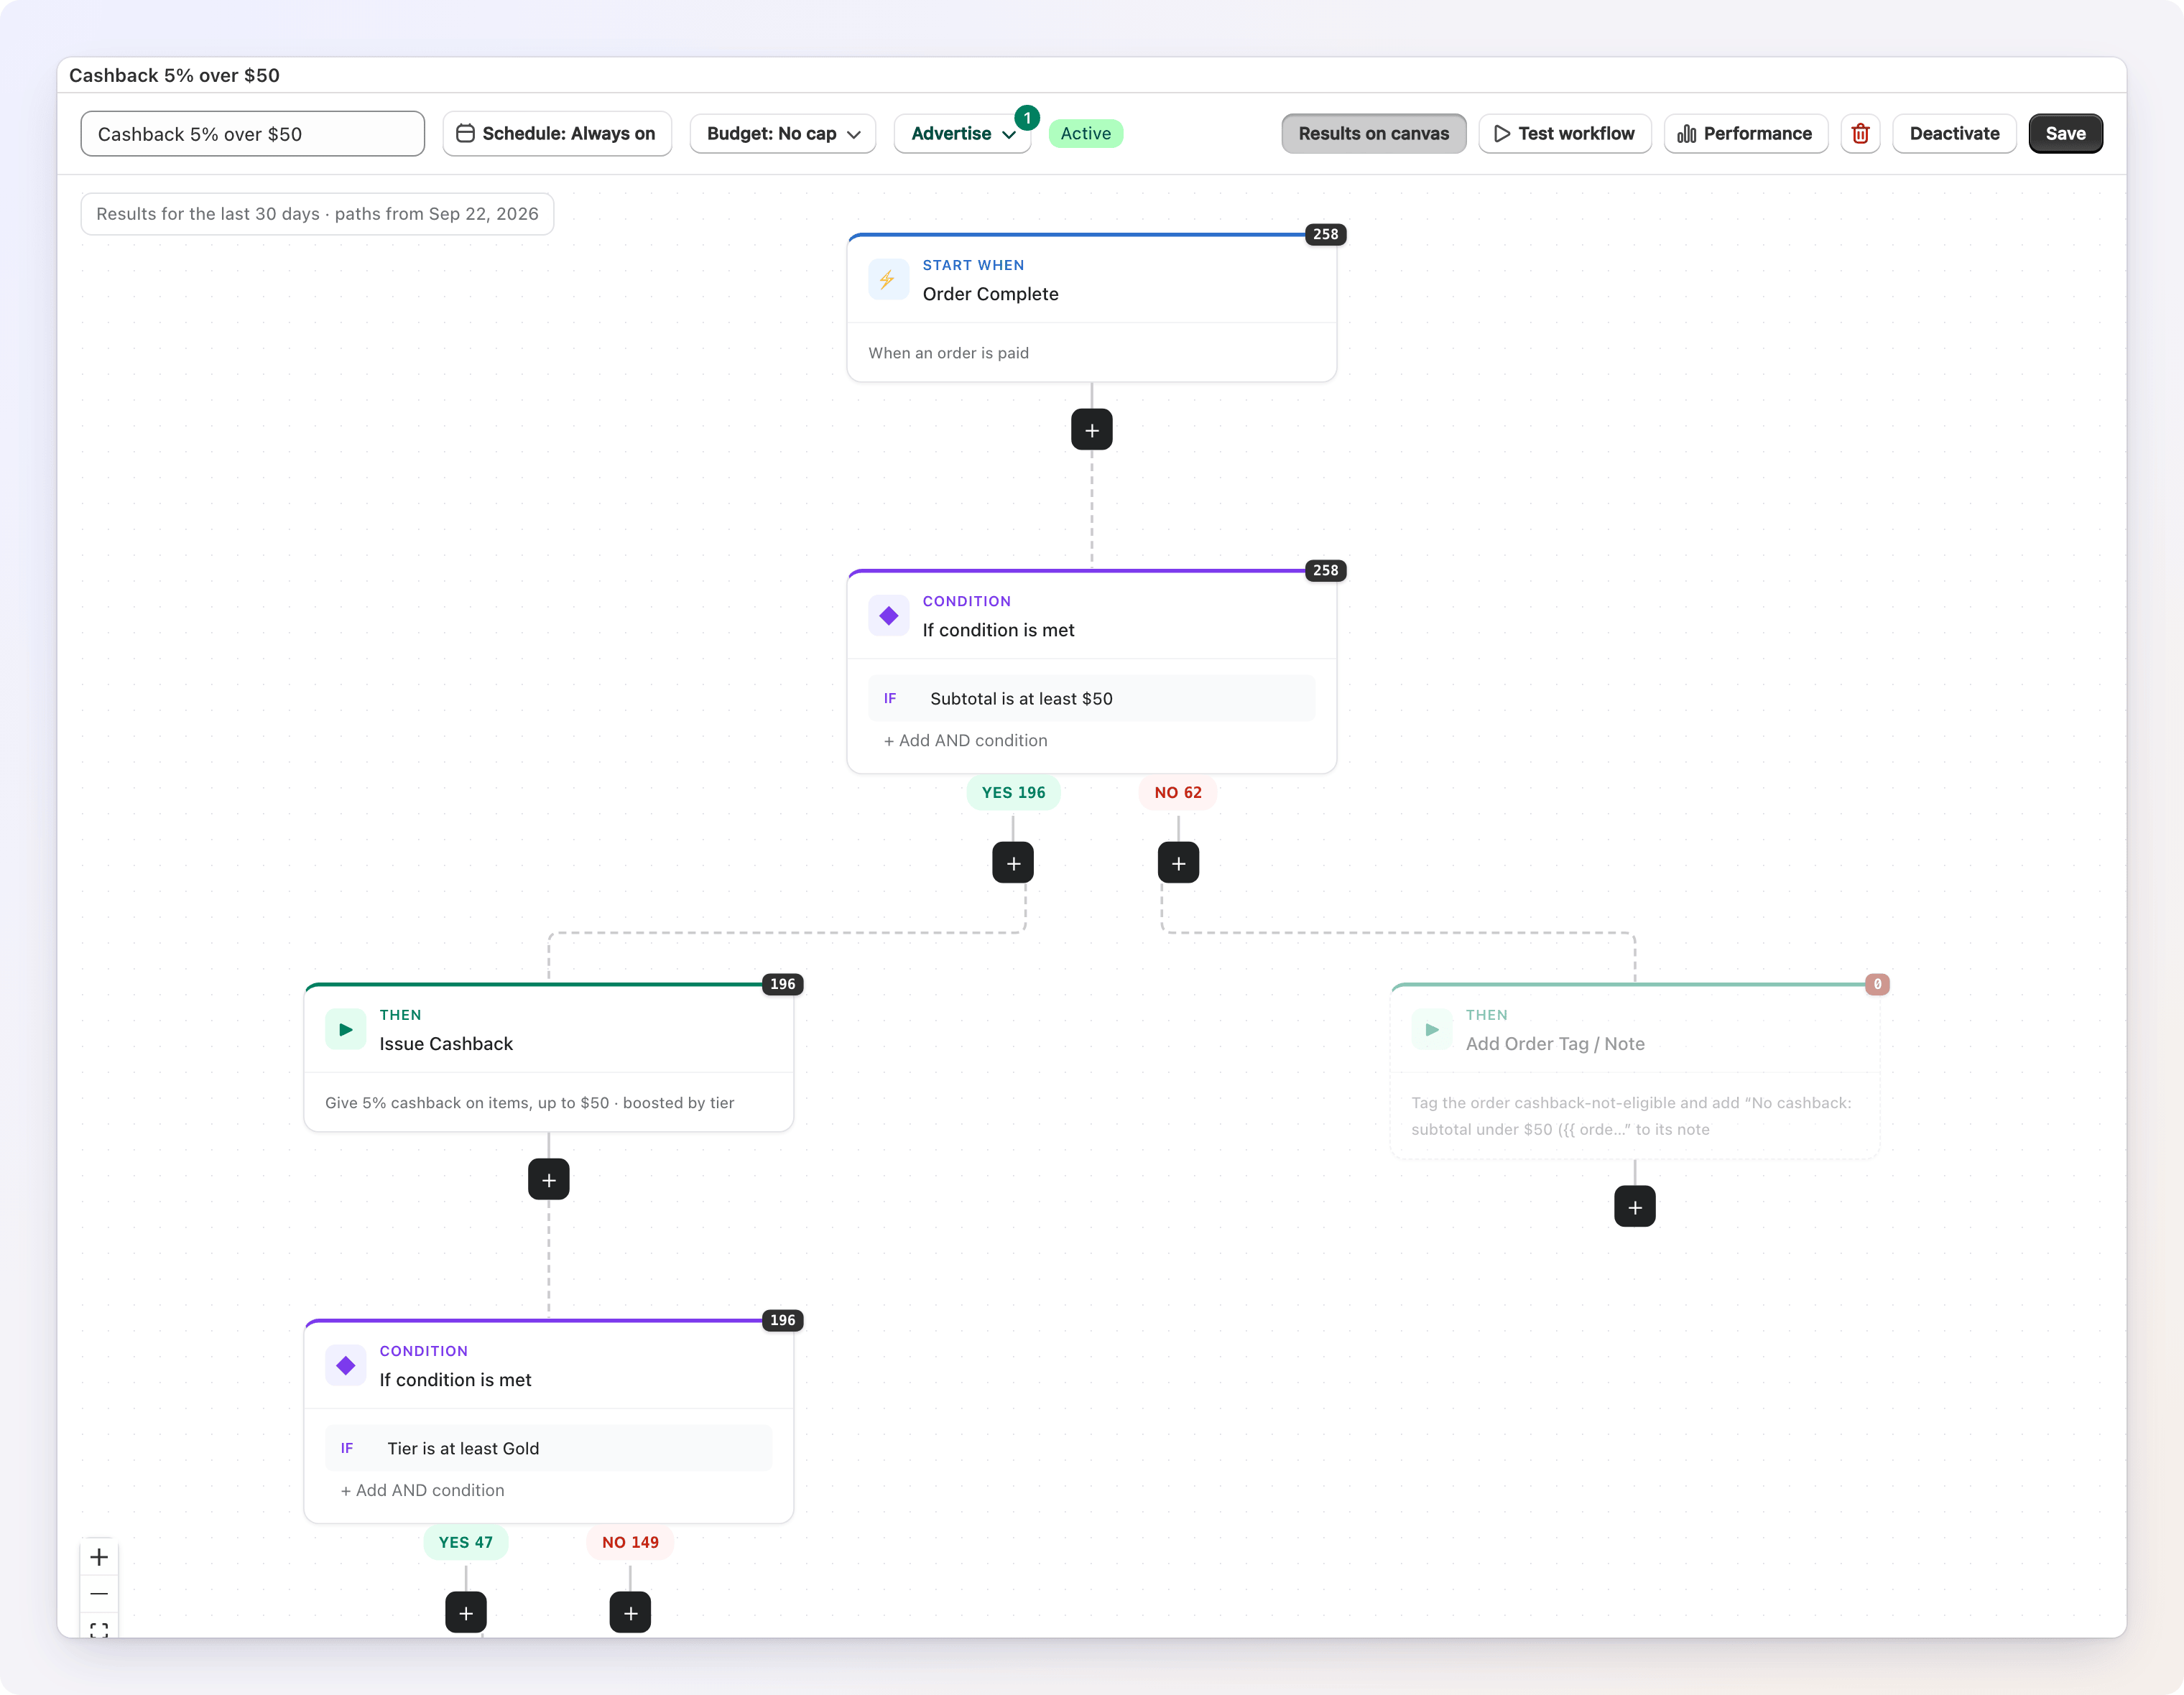
Results on canvas
Click Results on canvas in the toolbar to overlay real numbers directly on your workflow's trigger, conditions, and actions. A caption on the canvas names the period and the date the counts start from.
- The trigger and every action show how many times they fired.
- Every condition shows a YES / NO split.
- A step with zero activity in the window is dimmed, so you can spot a branch nobody ever reaches.
The overlay uses the period last chosen in the Performance panel (30 days if you haven't opened it). Path counts never reach back more than 90 days, even if you've picked All for the tiles above.
Promotion performance
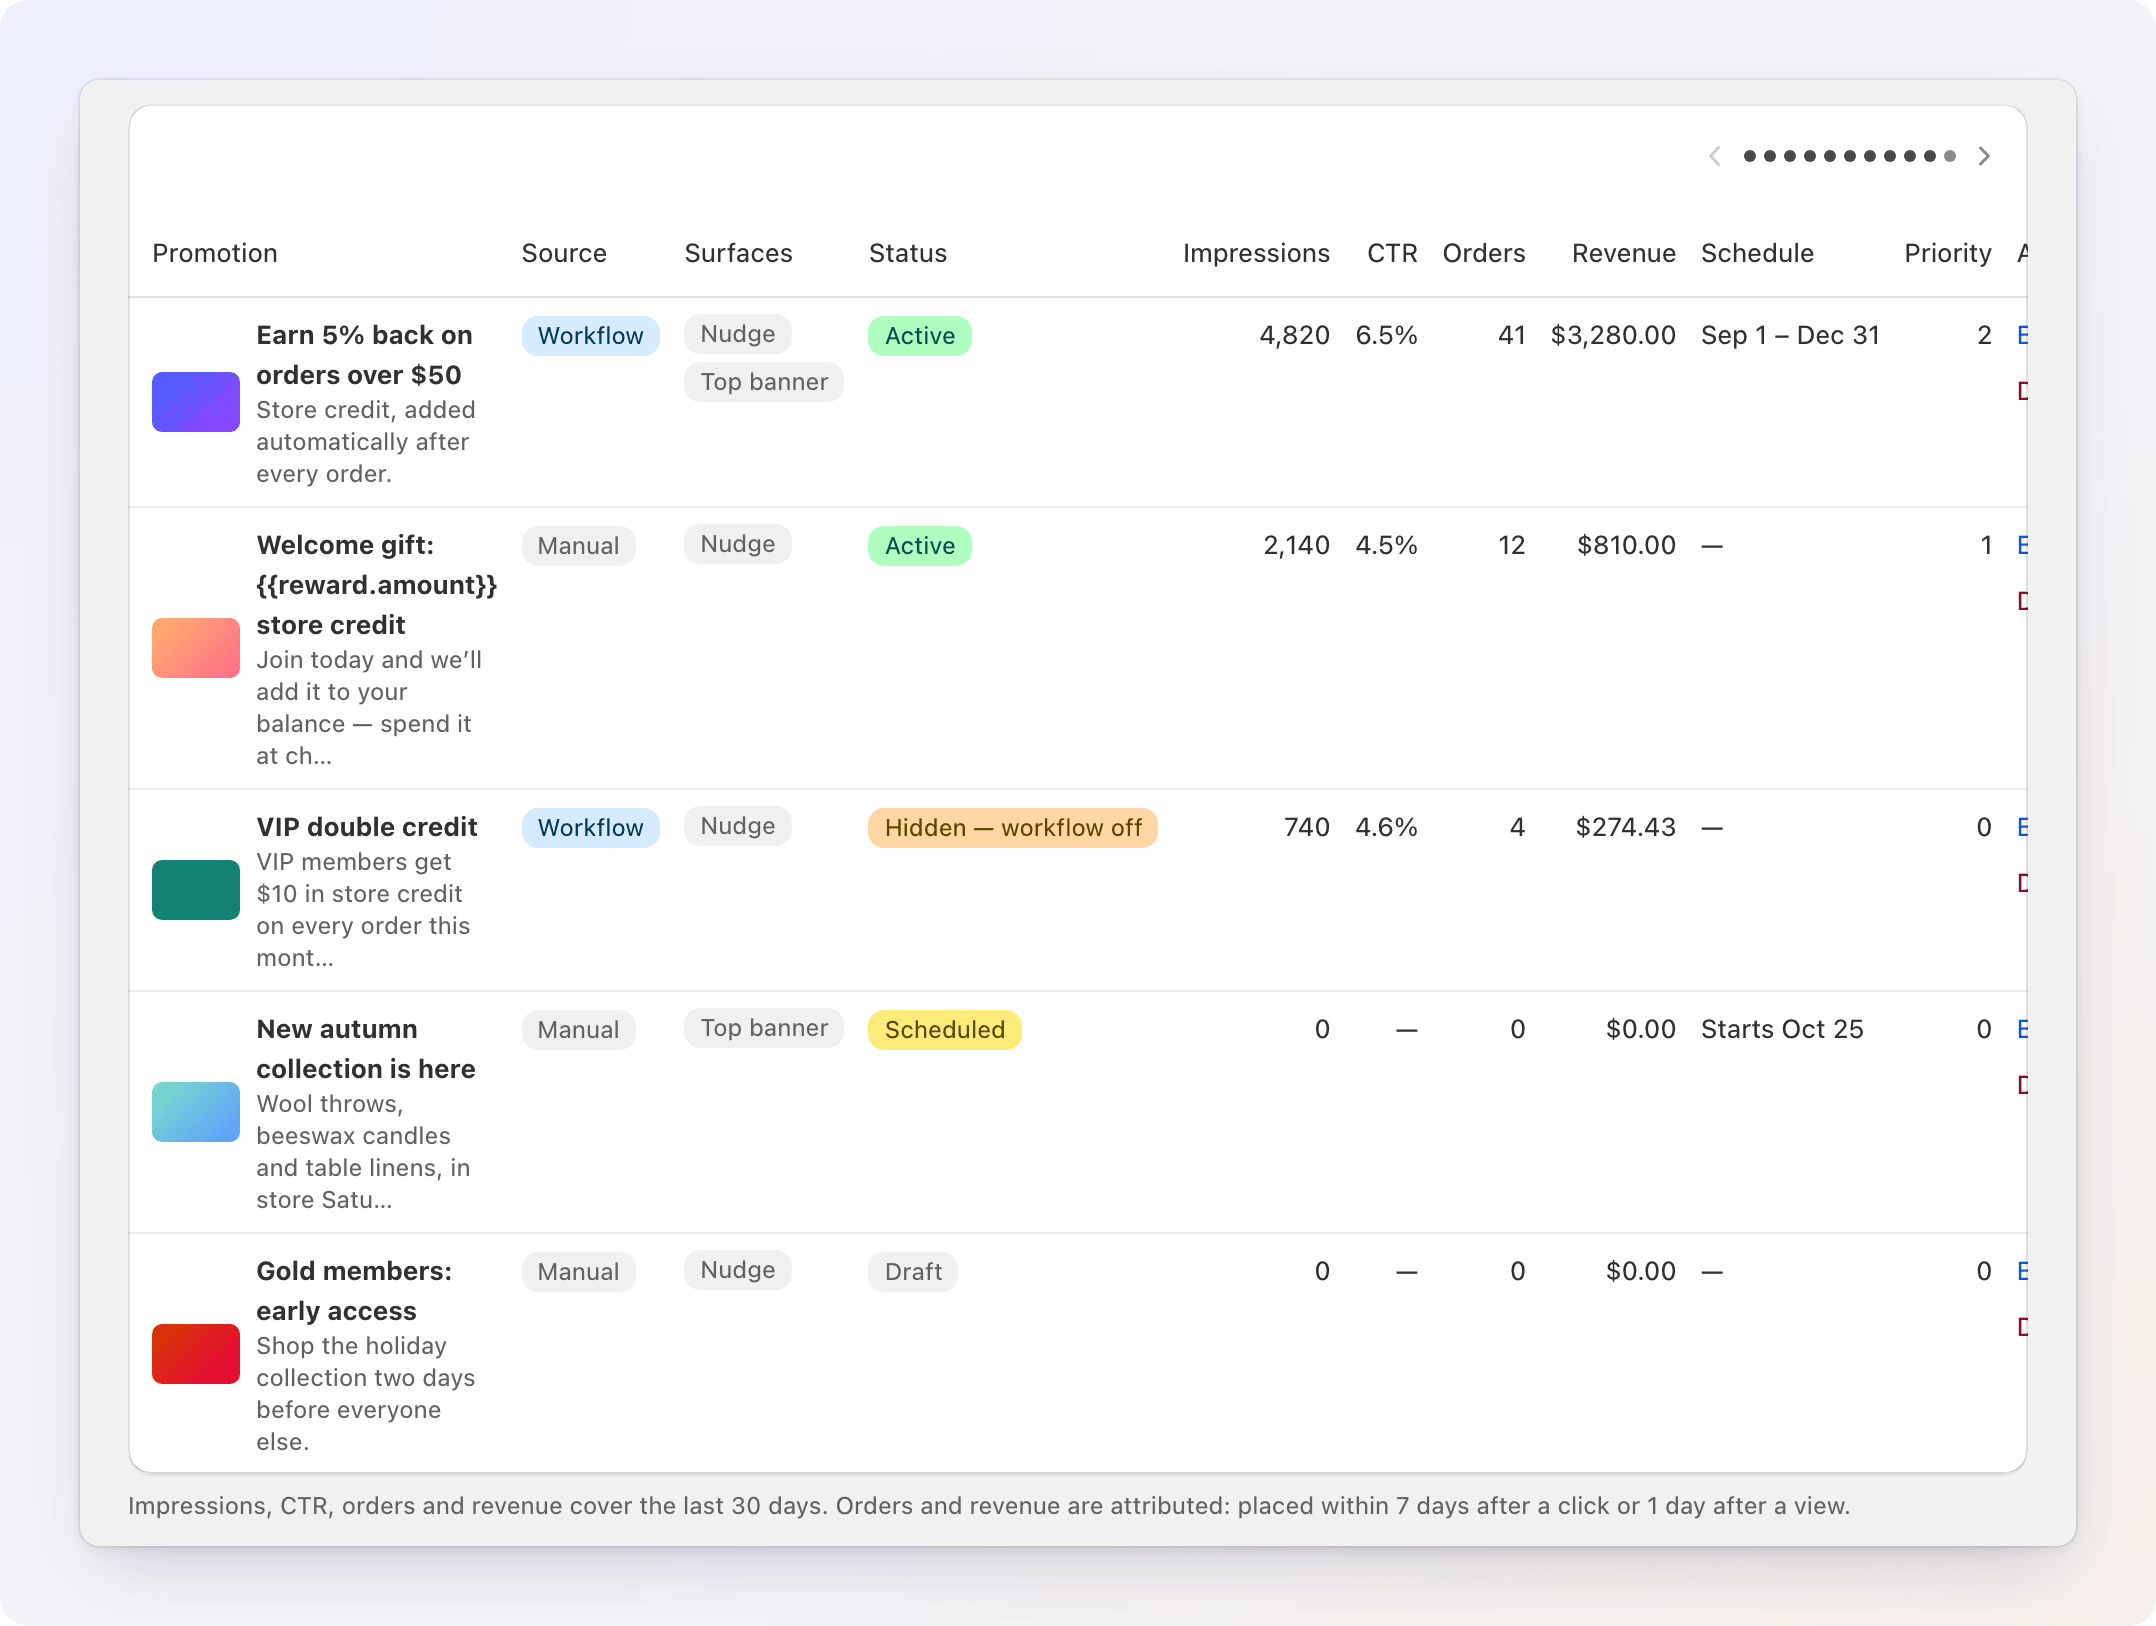
The Promotions list
To open the list, go to the Loyalty Dashboard and click Manage Promotions. It shows a rolling 30-day Impressions, CTR, Orders, and Revenue column set for every promotion, alongside its Source, Surfaces, Status, Schedule, and Priority. CTR shows — for a promotion with no button to click — see Shown and Clicks below.
The promotion editor's Performance card
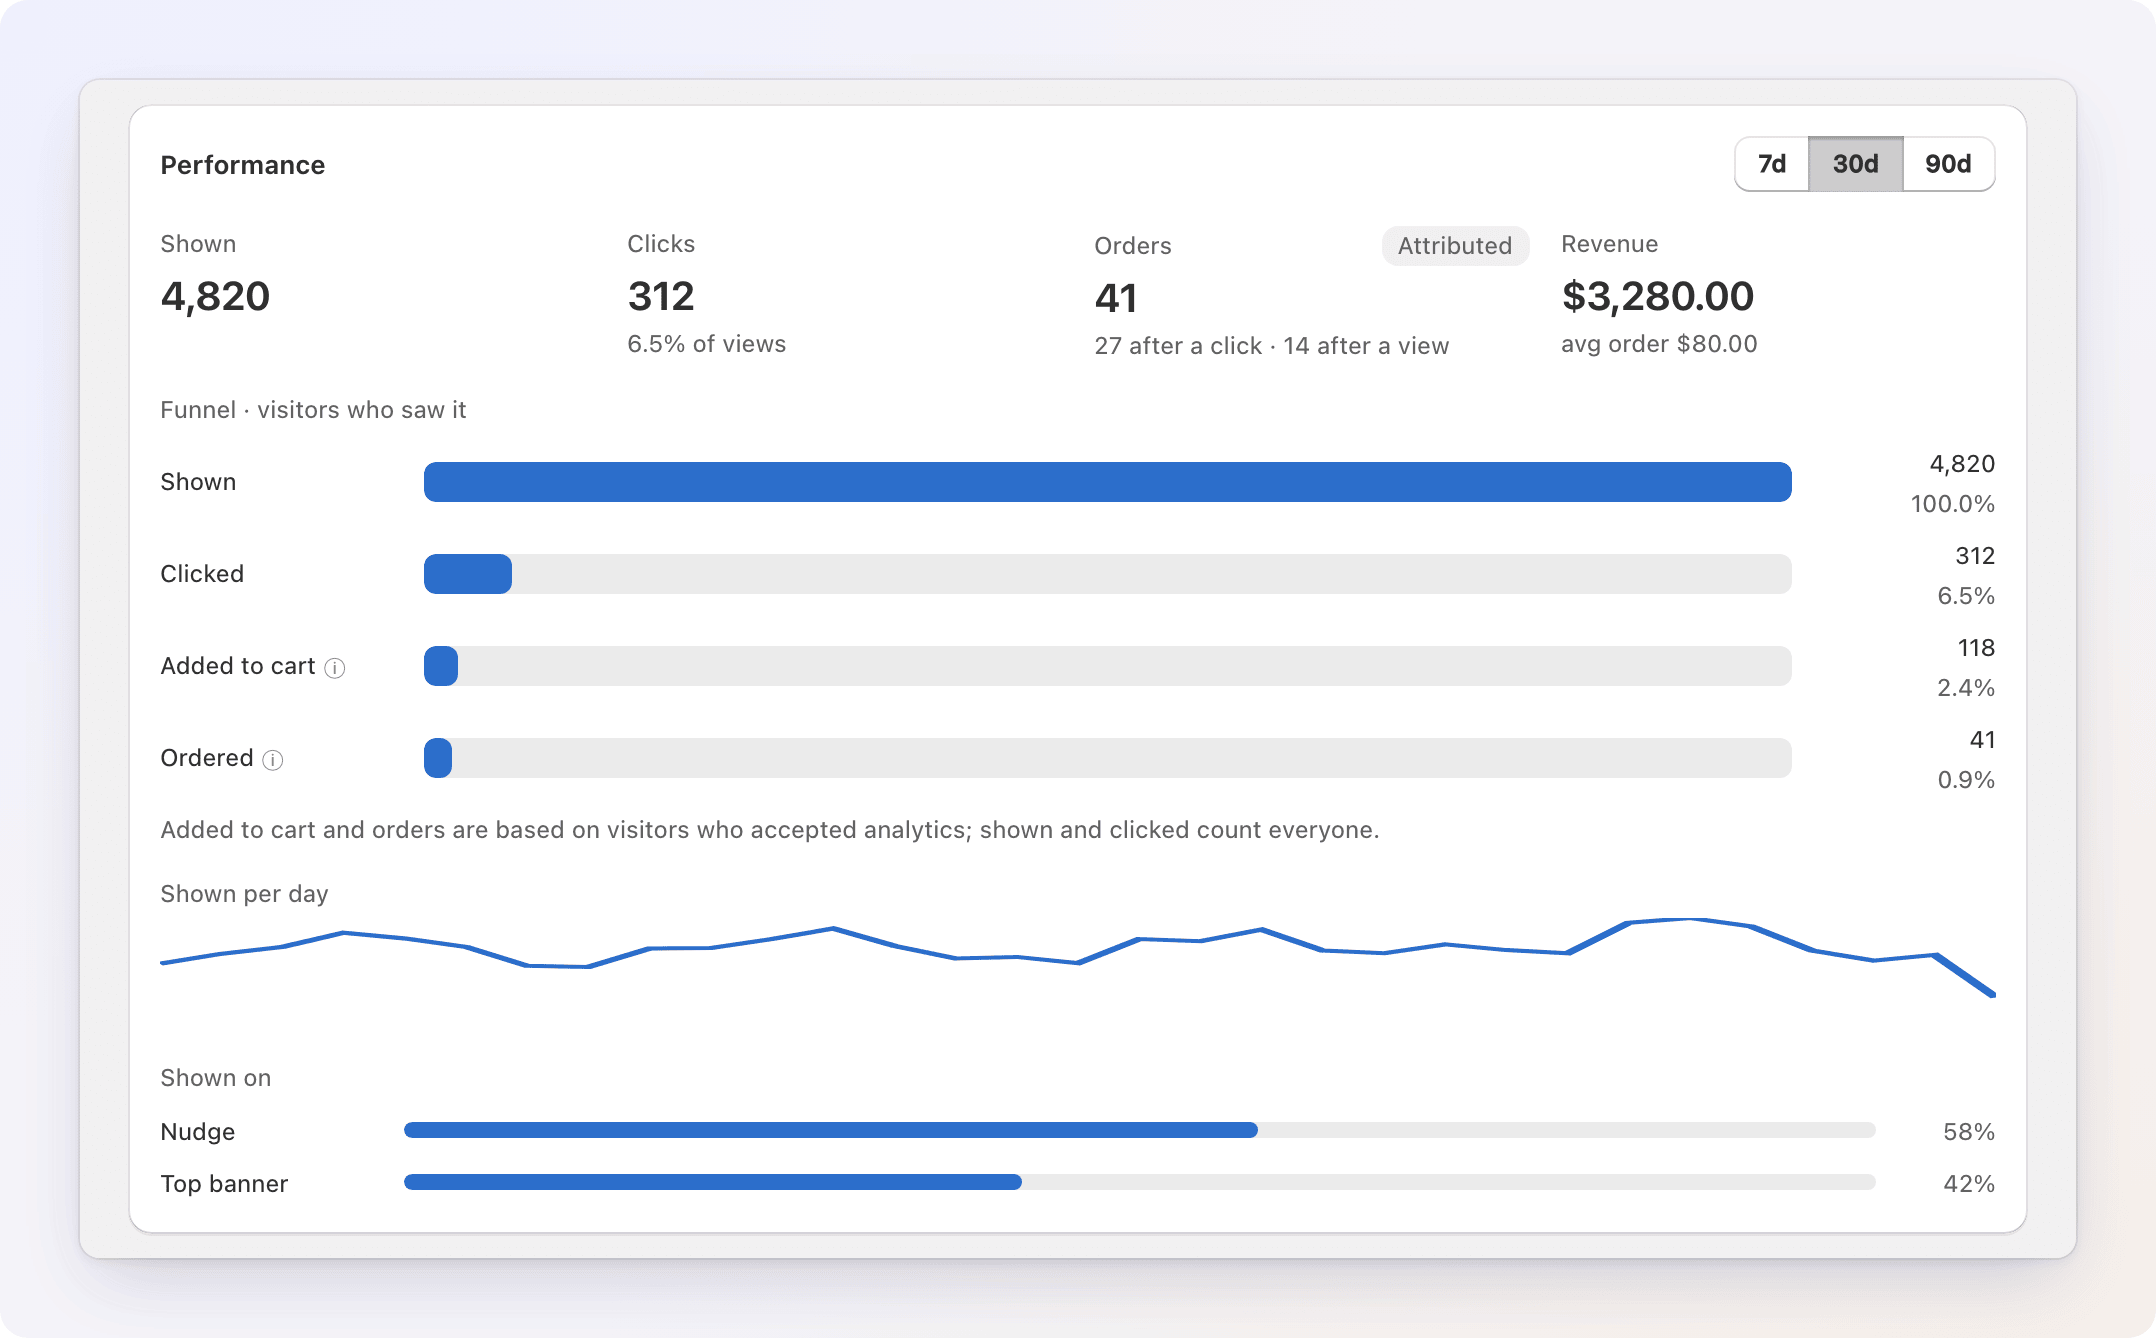
Open any saved promotion. Its Performance card sits at the top of the page, above the editor, switchable between 7d, 30d, and 90d. Until the promotion has been shown to shoppers, the card says "Results appear once the promotion is shown to shoppers."
| Tile | What it means |
|---|---|
| Shown | A viewable impression — the promotion was at least 50% on screen, continuously, for at least one full second. It is counted once per promotion and placement for each page view. |
| Clicks | Clicks on the promotion's button (or on the nudge card), with the click-through rate underneath. A promotion with no button (an announcement with nothing to click) shows — here — its next step is counted by views instead. |
| Orders (attributed) | Orders placed within 7 days of a click, or 1 day of a view, on this promotion — see Attributed vs. incremental revenue. The breakdown underneath splits orders that followed a click from orders that followed a view. |
| Revenue | The subtotal of those orders (products after discounts, before shipping and tax), with the average order value underneath. |
Shown and Clicks
"Shown" counts every visitor, whether or not they've accepted analytics cookies. "Clicks" does too — but only for promotions that have a button; a plain announcement with no CTA has nothing to record a click on. Visits from bots and automated browsers are not counted, and neither is anything you see in a storefront preview.
The funnel
Underneath the tiles, a funnel titled "Funnel · visitors who saw it" shows Shown → Clicked → Added to cart → Ordered, each as a share of "Shown." A skipped "Clicked" step (no button) is shown as a striped bar rather than zero, so it doesn't read as "nobody clicked." Added to cart and Ordered are only counted for visitors who accepted analytics cookies — a small ⓘ marks them — see Privacy below.
A small Shown per day chart plots impressions, and a Shown on breakdown shows which surface (Nudge or Top banner) earned them.
If your store measures promotion revenue as incremental (see below), the Performance card keeps showing attributed numbers for the single promotion — incrementality can only be measured for all your promotions together. A note at the bottom says so and links to Analytics → Loyalty & promotions.
Attributed vs. incremental revenue
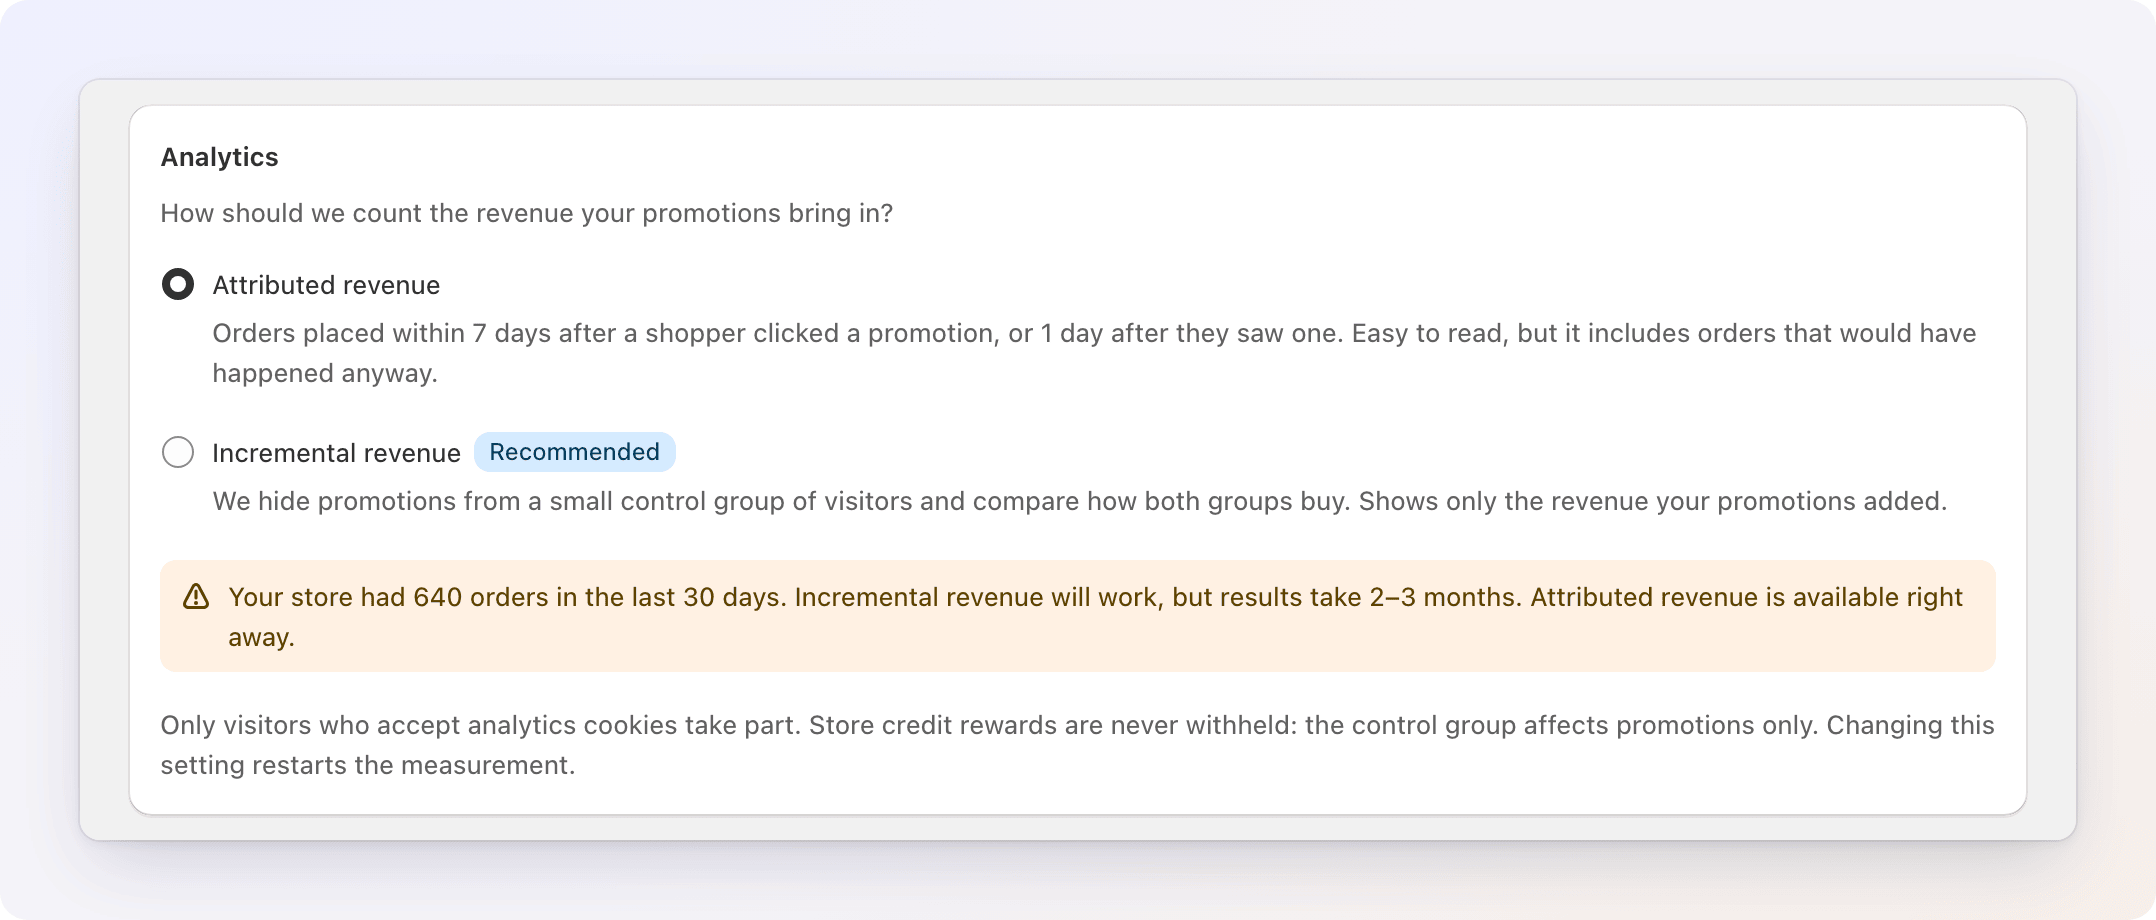
Gift Card Hero can measure your promotions' revenue two ways. Choose which one under Loyalty Settings → Analytics.
Attributed
The default. An order counts toward a promotion's revenue when it is paid within 7 days of a click, or 1 day of a view, on that promotion. If a shopper touched more than one promotion, the most recent qualifying touch wins the credit (a click at the same moment as a view wins over the view). The revenue counted is the order's subtotal: products after discounts, before shipping and tax.
Orders that were cancelled or fully refunded are excluded. A partially refunded order still counts.
Attributed revenue is simple and available immediately, but it doesn't prove the promotion caused the sale — it just tells you which orders followed exposure to it. As the tooltip on this number puts it: it includes orders that would have happened anyway.
Incremental
A more rigorous measurement. A percentage of your visitors — 5%, 10%, or 20%, your choice under Control group — are held out as a control group who never see any promotions at all. Gift Card Hero then compares the control group's conversion rate and revenue per visitor against everyone else's, to estimate the extra revenue your promotions produced.
A few things to know:
- Incremental measurement covers all your promotions together, store-wide. There's no way to isolate the incremental effect of one single promotion — only the store-level tile on the Analytics tab shows it.
- Store credit rewards are never withheld. The control group only affects which visitors see promotion nudges and banners — it has no effect on the loyalty rewards your workflows issue.
- Only visitors who accept analytics cookies take part in the control group and its measurement. Everyone else keeps seeing your promotions normally.
- A visitor stays in the same group. The same shopper always lands in the same group, so a control visitor doesn't start seeing promotions on the next visit.
- Changing the setting restarts the measurement. Switching between attributed and incremental, or changing the control-group percentage, starts a brand-new measurement window from that moment — history from before the change isn't carried forward.
Traffic requirements
Incremental measurement needs enough paid orders to reach a reliable answer. Settings counts your paid orders from the last 30 days and shows a banner under the choice:
| Paid orders in the last 30 days | Availability |
|---|---|
| 1,000 or more | Available. First results in about 3–4 weeks with a 20% control group, 4–6 weeks with 10%, or 8–10 weeks with 5%. |
| 300–999 | Available, but slower. Results take about 6–8 weeks with 20%, 2–3 months with 10%, or 4–5 months with 5%. |
| Under 300 | Not available. The Incremental revenue choice is disabled, and Settings keeps attributed revenue until your order volume grows. |
Reading the result
The Extra revenue from promotions tile shows one of three states while incremental mode is on:
| State | Meaning |
|---|---|
| Still measuring | Not enough orders yet. The tile needs at least 30 orders in the control group and in the group that saw promotions, and enough orders overall for a reliable answer. A progress bar shows how far along it is, with roughly how many more orders are needed. |
| Extra revenue, with a range | A statistically significant difference was found. Shows the estimated extra (or reduced) revenue marked Incremental, a 95% confidence range in its tooltip, and the conversion lift versus visitors who didn't see promotions. |
| No measurable lift yet | Enough data was collected, but no meaningful difference showed up between visitors who saw promotions and the control group who didn't. |
Privacy: what's tracked and what's not
The promotions widget reads your promotions from your store's own data and never needs Gift Card Hero's servers to display them. For analytics it only sends counters back.
Gift Card Hero only tracks individual visitors, orders, and control-group membership for shoppers who accept analytics cookies in your store's cookie consent banner.
- Shown and Clicks count every visitor, consented or not — these are anonymous counters with no visitor id attached.
- Added to cart, Orders, the order-attribution windows, and control-group membership only ever cover visitors who accepted analytics cookies.
Wherever a number on the Performance card depends on consent, it's marked so — the funnel's "Added to cart" and "Ordered" steps carry a small note explaining that they only reflect consented visitors.
For consenting visitors, Gift Card Hero adds a few private attributes, with names starting with _gh_, to the cart. Shopify copies them onto the order, and they are what matches an order to a promotion. They are hidden from customers at checkout and contain no personal data: only promotion ids, times, an anonymous visitor id and the group.
A change to Gift Cards analytics
Loyalty store credit is a Shopify gift card behind the scenes, so before loyalty analytics existed, that spending showed up mixed into your regular Gift Cards analytics. It's been moved: loyalty store credit is now excluded from the Gift Cards tab entirely and reported here instead. A note on the Gift cards tab says so, with a Show loyalty & promotions button.
If your Gift Cards totals look lower than they used to for the same period, this is why — the numbers didn't shrink, they moved to the Loyalty & promotions tab.
FAQ
Why don't my Promotions list numbers match the promotion editor's Performance card? The list always shows a rolling 30 days. The editor's Performance card lets you pick 7d, 30d, or 90d — make sure you're comparing the same window.
A promotion shows Clicks as "—". Is something broken? No — that promotion has no button (it's a plain announcement), so there's nothing to record a click on. Its funnel counts "Added to cart" and "Ordered" from views instead.
My promotion shows many views but few or no orders. Why? Orders are only matched to a promotion for visitors who accepted analytics cookies, and only when they were paid within the attribution window. If many of your visitors decline cookies, the order count will be lower than your real sales. The views and clicks are not affected.
I never see the "Promotion revenue" tile. The tile appears once you have run a promotion (any promotion that isn't a draft). Create and activate one in Promotions.
Revenue from store credit is higher than the credit customers spent. Is that right? Yes. "Revenue from store credit" is the full value of the orders that used credit. The cash the customers added on top is shown in Cash on top of credit.
I turned on incremental measurement and the tile still says "Still measuring" after weeks. Why? Your store's order volume determines how fast this fills in — see Traffic requirements above. A smaller control group (5%) reaches an answer slower than a larger one (20%) because fewer control orders accumulate per week. Only orders from visitors who accepted analytics cookies count, so a store where many visitors decline them fills in more slowly.
Can I see incremental lift for just one promotion? No. Incremental measurement only works store-wide, because the control group holds back every promotion at once, not one at a time. Use the attributed numbers on that promotion's own Performance card instead.
Why did my Gift Cards revenue drop after an update? See A change to Gift Cards analytics above — loyalty store credit moved to the Loyalty & promotions tab, it wasn't lost.